Validation
We validate all the implementation in MetaCommunityMetrics that have equivalent implementations in R to make sure the functions in MetaCommunityMetrics are correct and accurate as the equivalent functions in R. All validation results are presented to 4 decimal places (±0.0001) here. Except for the DNCI, which is based on permutations (results vary with each permutation), all functions have a result of less than 4 decimal places of absolute difference between ours and the R ones. We consider this as floating-point differences between implementations, and differences smaller than 0.0001 were considered negligible for both statistical and ecological applications of these metrics. These minimal differences indicate that our functions are working as intended as the ones in R. All validations were performed using the sample dataset included in the package (accessible via load_sample_data()), which consists of rodent community survey data from the Portal Project.
Validation Result
Beta Diversity
*Absolute Differences between the results from MetaCommunityMetrics and the equvilant functions in R are shown here. All values *
| TestCase | BDtotal | Repl | RichDif |
|---|---|---|---|
| Beta Diversity (Abundance, quant=true) | 0.0000 | 0.0000 | 0.0000 |
| Beta Diversity (Abundance, quant=false) | 0.0000 | 0.0000 | 0.0000 |
| Beta Diversity (Presence, quant=false) | 0.0000 | 0.0000 | 0.0000 |
| Spatial Beta Diversity (Abundance, quant=true) | 0.0000 | 0.0000 | 0.0000 |
| Spatial Beta Diversity (Abundance, quant=false) | 0.0000 | 0.0000 | 0.0000 |
| Spatial Beta Diversity (Presence, quant=false) | 0.0000 | 0.0000 | 0.0000 |
| Temporal Beta Diversity (Abundance, quant=true) | 0.0000 | 0.0000 | 0.0000 |
| Temporal Beta Diversity (Abundance, quant=false) | 0.0000 | 0.0000 | 0.0000 |
| Temporal Beta Diversity (Presence, quant=false) | 0.0000 | 0.0000 | 0.0000 |
Dispersal-niche continuum index
*A plot showing the distribution of the DNCI values of different group pairs from R and Julia, each pair are ran for 100 times, with 1000 permutations each time. 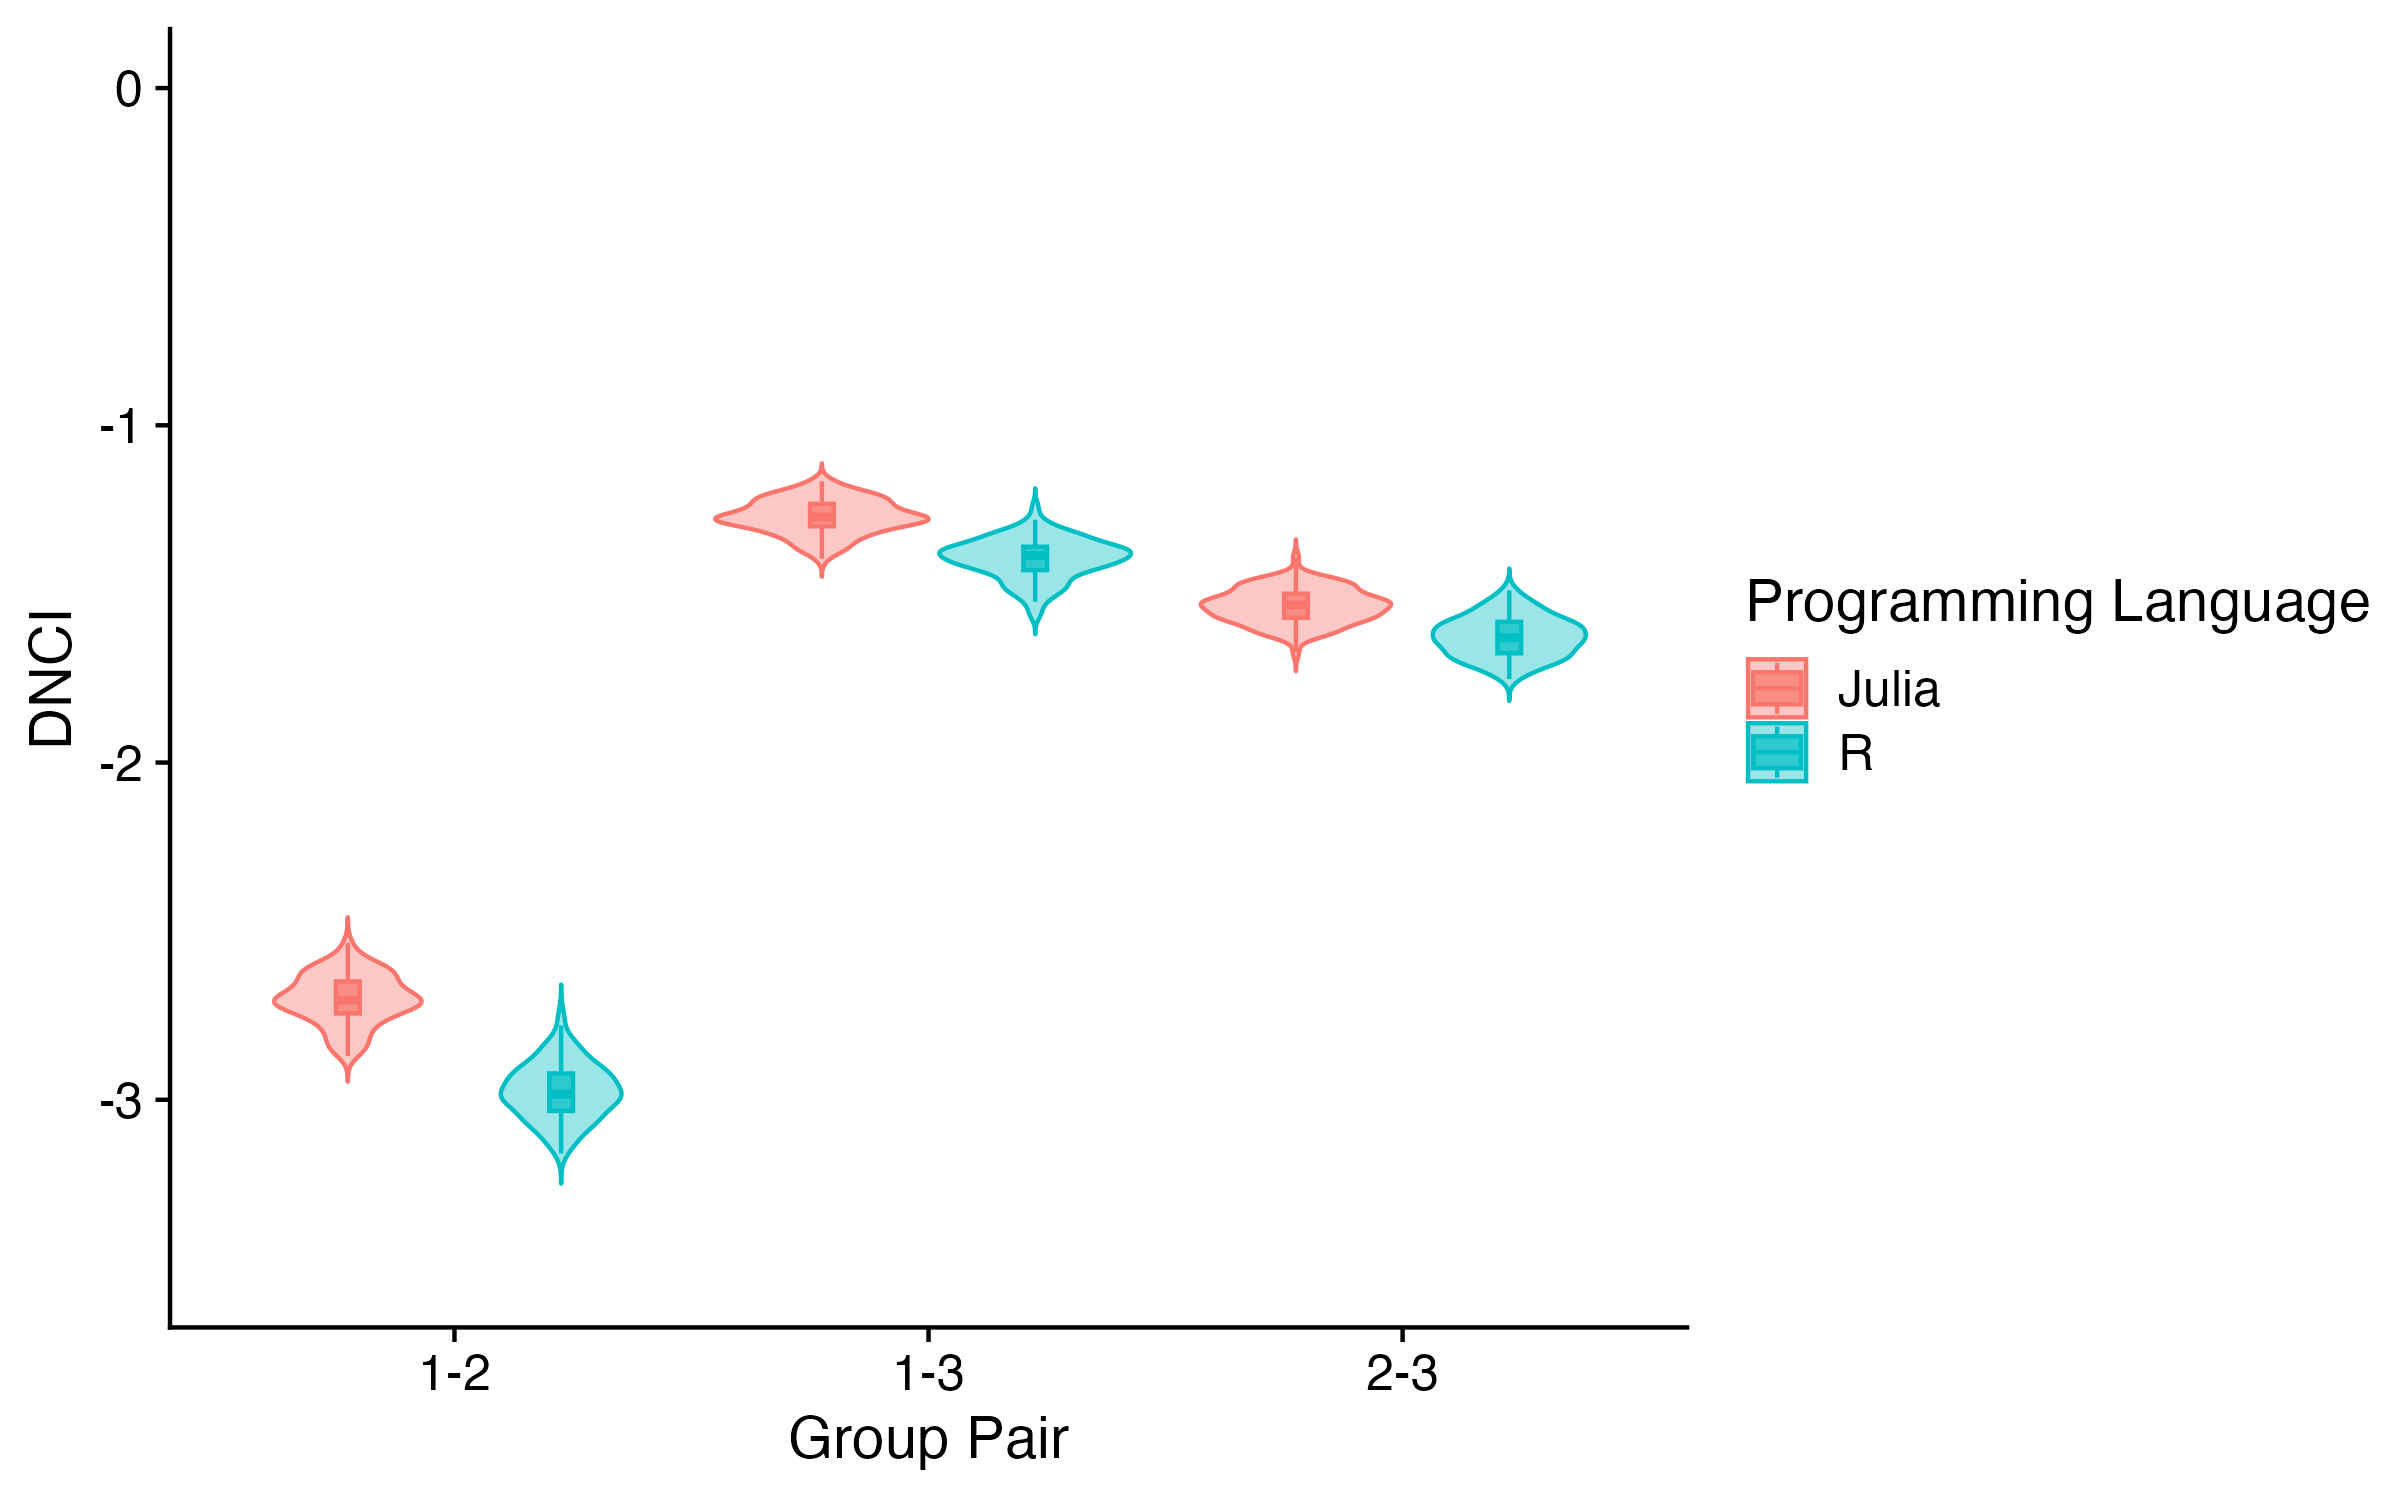
The above plot shows the validation result of the DNCI function using our sample data for the case when Sampling_date_order $=$ 60. Our results agree with those from the R implementation. All group pairs show ranges of DNCI values significantly smaller than zero across both implementations, and the ranges of each group pair overlap between our implementation and the R implementation except for group pair 1-4. These results indicate that both implementations agree that dispersal is the process dominating the metacommunity at the given time point, but our implementation results in a relatively stronger potential strength of dispersal (higher absolute values). This difference arises from a deliberate design choice: the R implementation prevents empty sites in the column-sum-preserving null model by redistributing species from species-rich localities to empty sites, implicitly assuming that dispersal is sufficient to colonize all sites. In contrast, our implementation allows empty sites in the null model, reflecting the ecological assumption that dispersal limitation can result in uncolonized sites, which is common in simulation workflows. As a result, DNCI values from our implementation are not directly comparable to those from the R implementation, and users should be aware of this difference when interpreting results.
Occupied Patches Proportion
Absolute Differences between the results from MetaCommunityMetrics and the equvilant functions in R are shown here.
| meanproppatches | minproppatches | maxproppatches |
|---|---|---|
| 0.0000 | 0.0000 | 0.0000 |
Variability Metrics
Absolute Differences between the results from MetaCommunityMetrics and the equvilant functions in R are shown here.
| CVsl | CVsr | CVcl | CVcr |
|---|---|---|---|
| 0.0000 | 0.0000 | 0.0000 | 0.0000 |
Hypervolume
Absolute Differences between the results from MetaCommunityMetrics and the equvilant functions in R are shown here.
Volume
| total | correlation | Temperature | Precipitation |
|---|---|---|---|
| 0.0000 | 0.0000 | 0.0000 | 0.0000 |
Volume dissimilarity
| Metric | total | correlation | Temperature | Precipitation |
|---|---|---|---|---|
| Bhattacharyya_distance | 0.0000 | 0.0000 | 0.0000 | 0.0000 |
| Mahalanobis_distance | 0.0000 | 0.0000 | 0.0000 | 0.0000 |
| Determinant_ratio | 0.0000 | 0.0000 | 0.0000 | 0.0000 |